
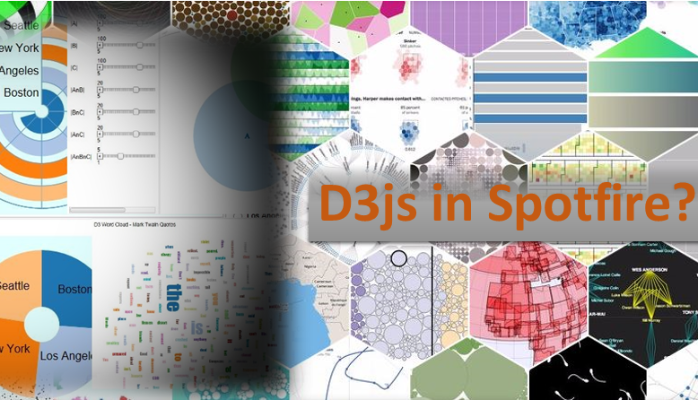
This article describes a smart extension to TIBCO Spotfire which allows the use of D3 Javascript visualizations in Spotfire
Are you an experienced Spotfire user looking jealously on the diversity of data driven visualizations in d3.js? Or are you an experienced developer looking for a standard enterprise analytics platform where you can deliver your ideas to the end users?
TIBCO Spotfire is long known as the top notch platform when it comes to high end enterprise visual analytics capabilities, although other products like Tableau or Qlick View have often larger varieties of fancy, eye caching visualizations in the dashboards they produce.
Recently I have learned about a smart extension to the Spotfire Platform developed by the Professionals at TIBCO Spotfire.
This so called java script custom visual (JSVis) is in fact a generic Custom Visual. More information on extending the Spotfire Platforms and implementing Custom Visuals can be found under old site (I think this is discontinued): Spotfire Technology Network (http://stn.spotfire.com/), or for more recent versions:https://docs.tibco.com/products.
The JSVis custom visual is the link between the Spotfire data engine (Data Tables, filtering, markings etc.) and the limitless world of java script visualization capabilities like those in d3js.
To configure a new JSVis in Spotfire, one has to define the data which should drive the Visualization (select the data table, select the columns, define aggregation etc.) and to upload the custom java script code together with all referenced libraries (like d3.**.js, jQuery.js, etc.)
Those familiar with the Spotfire SDK, know that developing a Custom Visual is the most code intensive extension to the Spotfire platform. With JSVis the development time can be slashed down from weeks to days.